
The Current And Future State Of The WFM Systems Market
“As economic power continues to flow from seller to buyer, it becomes increasingly important to strategically leverage the consumer information that resides in the contact center.”

Every two years, Pelorus Associates publishes a comprehensive market analysis of the state of the contact center workforce management market. We published our first WFM report in 2007 and just released the fifth in this series, 2016 World Contact Center Workforce Management Systems Market. This history provides a rich database and perspective to spot trends and extrapolate future demand. While the product focus is on WFM, much of the content examines underlying trends, developments and demand drivers that are equally applicable to other contact center investments as well. As the author of this report, I’d like to take this opportunity to share some high-level results.
Major Trends
In the full report, we examine trends at three levels: environmental or macro, contact center and vendor level. This encompasses 30 trends, ranging from the Gig economy to the future of the omnichannel contact center. Following are three trends that are very important in shaping the way businesses deliver customer care now and in the future.
I WANT IT MY WAY.
The preference for individuality over conformity can be seen every day. Businesses seeking to win over today’s consumers need to have a thorough understanding of customer preferences and possess the agility to respond faster than their competitors. As economic power continues to flow from seller to buyer, it becomes increasingly important to strategically leverage the consumer information that resides in the contact center.
PENDING LABOR SHORTAGES. U.S.
unemployment dropped to 4.9% in July 2016 thanks to continued economic growth, boomer retirements and a productivity slump that forced companies to add new workers. This will exacerbate the already difficult job of recruiting and retaining qualified customer service representatives. It will also impact labor costs. For contact centers, this means continued focus on understanding and improving agent satisfaction and using tools such as workforce management to empower agents to exert more control over their schedules and personal development. It also means that compensation levels need to be re-examined to help assure that your best people are retained.
GROWTH OF ON-DEMAND MODEL.
When we published our 2011 WFM report, only two vendors offered a workforce management solution via a hosted model. Now, they all do either directly or through partners. Cloud transactions now account for about 9% of WFM global WFM revenues, up sharply from our prior reports and it will likely double in the next two years.
Demand Drivers
Many factors drive demand for WFM. Three of the most important are the desire to improve the customer experience, growing complexity in the contact center, and a powerful ROI generated through WFM investments.
DESIRE TO IMPROVE CUSTOMER EXPERIENCE.
Increasing competition and slower overall market growth among major service businesses has shifted management priorities from customer growth to customer retention. Workforce management software enables contact centers to more effectively deploy resources and achieve targeted service levels.
GROWING COMPLEXITY.
Today’s contact centers require multiple skill groups with specializations in languages, product knowledge, customer retention, sales, complaint handling, collections and other skills. The modern contact center has a mix of part- time and full-time employees, brick-and-mortar and remote agents—and all in one location or scattered around the globe. Manual or even early generation automated scheduling solutions are simply incapable dealing with today’s complexity.
STRONG BUSINESS CASE.
No WFO application offers the demonstrably attractive ROI of workforce management. If the contact center is reasonably large, say 30 to 50 agents, and is currently doing forecasting and scheduling by Excel and Erlang formulas, there is no question that WFM is a shrewd investment.
Constraints
Balanced against the many factors that encourage growth of workforce management systems and related WFO solutions are other forces that tend to constrain contact center deployment.
LOW LABOR COSTS MITIGATE THE NEED FOR SCHEDULE OPTIMIZATION.
A perennial constraint is that the business case for WFM starts to break down when labor is plentiful and cheap. A 500-agent contact center in Manila, where labor costs are 10% to 20% of the U.S. norm, would have to reduce labor hours by 7% to 10% just to break even on the investment, not counting the cost of IT support, system administration and annual service contract fees.
In Costa Rica, which is a popular location for international outsourcing firms, the federal minimum wage is only 90 cents per hour, for example. In many jurisdictions in Australia, Canada, Germany and the United States, the minimum wage exceeds $10 per hour. In the U.S., the median hourly wage for customer service representatives is $15.25.
ORGANIZATIONS NOT ALIGNED AROUND THE CUSTOMER.
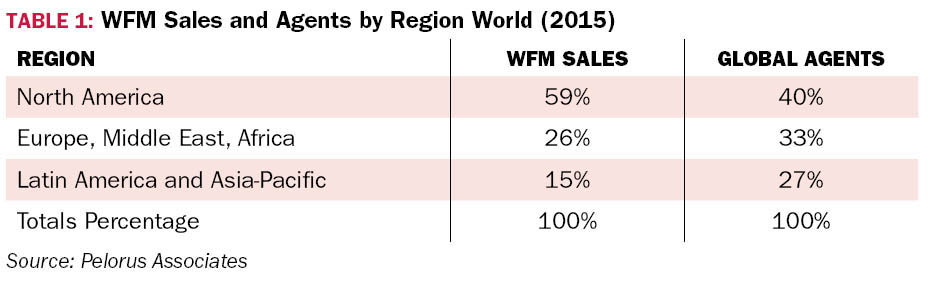
In North America and Western Europe, it’s all about the customer. In lesser developed nations—not so much. These economies are still largely supply-driven rather than consumer-driven. As a consequence, sales of workforce management software are proportionally less than should be expected. (SEE TABLE 1.)
On the positive side, we are seeing significant investments in WFM and related WFO applications on the part of leading international outsourcers. Their North American and European clients are demanding that they achieve customer satisfaction and service levels goals as well as cost commitments.
Market Size
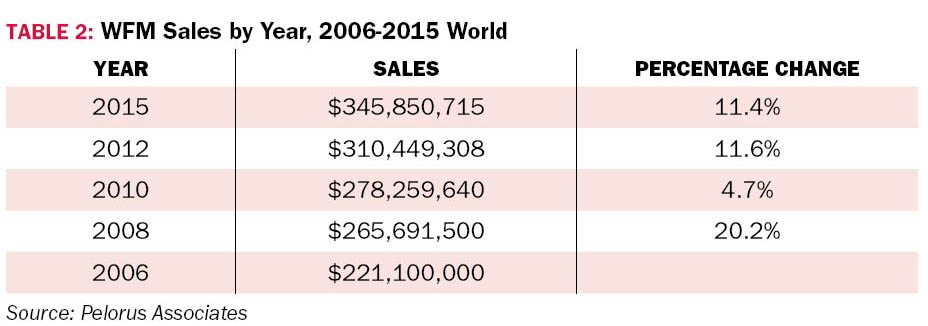
Our models for calculating industry sales and market shares rely on a blend of public information and vendor feedback. We calculate that over the nine-year period from 2006 to 2015, the WFM market has increased by approximately 6% per year. This is the steady and unspectacular growth characteristic of products and the maturity phase of the product lifecycle. (SEE TABLE 2.)
We expect the growth rate to accelerate modestly and, by 2019, global sales will reach $468.8 million. Major factors behind this growth include replacement of legacy product with more advanced solutions, agent growth in the 2% to 3% per year range, rising labor costs, and the pattern of WFO vendors to increase effective prices by bundling previously optional capabilities.
The supply side for workforce management software is highly concentrated among three dominant vendors: Aspect, NICE Systems and Verint Systems. In 2015, these three vendors accounted for 72% of the total market. While substantial, aggregate share for the Big Three is down from 81% in 2006. Smaller vendors such as Calabrio and Teleopti have been growing at faster rates and are making gains in market share.
Where to From Here?
Over the many years we have studied the WFM market, product evolution has largely been vendor driven. However, over the past two report cycles, we are seeing a stronger shift toward changes driven by the contact centers rather than your vendors. This shows up in the number of vendors that are now offering mobility capability, personalization tools, multichannel forecasting, what-if modeling and user interfaces that are much easier to learn and use.
Mobility is a great example. In 2013, there were two or three vendors that provided integration with leading mobile operating systems and these were little more than another way to view the data that was on their workstations. Now we are seeing true value-add from mobility. Examples include shift bidding, time-off requests and notifications/response systems. And we believe the industry is just touching the tip of the iceberg in empowering the mobile workforce. We will also expect to see continuing convergence of related applications such as performance management, gamification and coaching folded into more powerful workforce management solutions.
Dick Bucci is the Principal and Chief Analyst at Pelorus Associates, which provides market research and consulting services to the contact center industry.
– Reprinted with permission from Contact Center Pipeline, http://www.contactcenterpipeline.com